If you want to get invested or add to your position but are crying since you missed out on the last correction since the start of September, you be happy to note that seasonally, there should be some weakness before the election.
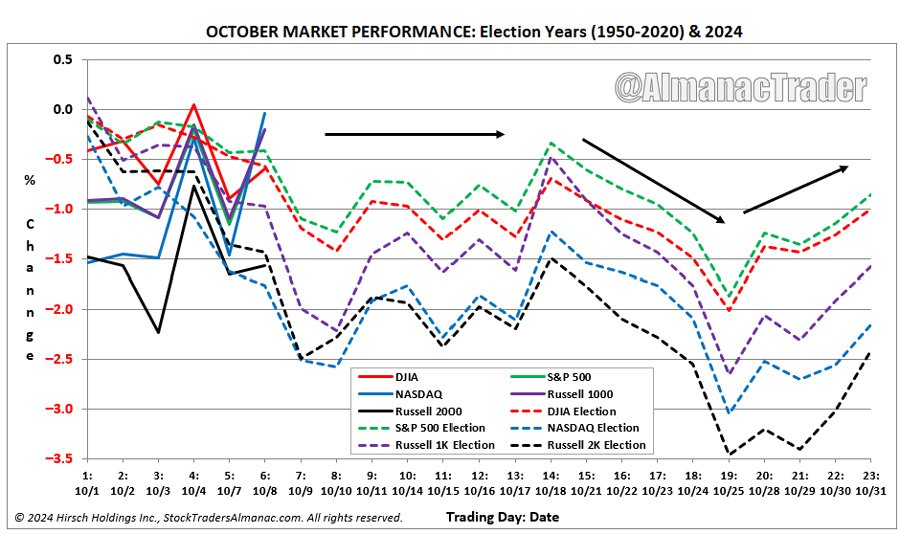
The chart above, compiled by All Star Charts, shows the current S&P 500 calendar year performance against the index’s average performance during election years. Observe that there are some dips during the election years.
If you want a more detail chart here is another:
It is a choppy two weeks.
The seasonality can be partly due to large market forces such as the actions of options dealers. This is the degree of support or weakness that I can gather:
The Vanna and Charm flows will be supportive of the markets from now till 16th October Wednesday, which is the day where VIX call options will expire. From there till 5th Nov 2024, there is a window of weakness where there is a lack of supportive flows. Markets do not automatically go down during this window of weakness but they just need some jolt to go down easily. This may explain seasonally why there is a weakness during such a small window.
This may be an opportunity to buy.
The Corrections Before the Last Three Elections
I went back to dig the price action of the S&P 500 ETF during the last three period before, during, and after the election.
This is 2020:
This correction was about 7.4%.
This is 2016:
This correction was about 3.3%
This is 2012:
This correction is about 4.9%.
The common theme is that the market has continued up after the election. This is not always the case. We know what happens in