Summary: With SPX closing below its 10-month moving average, a sell signal for a popular trend following system triggered today. This system has handily beaten the long-term performance of just holding SPX.
So what happens next? Using data from the last 38 years, there is an even chance that SPX reverses direction and moves higher from here over the months ahead. But the October low – or very close to it – appears likely to be retested in November.
After rising every month for 6 months since the end of March, and in the process gaining more than 10%, US equities fell hard in October. SPX dropped 7%, NDX 9% and small caps 11%.
This was the third worst month since the bull market started 116 months ago in March 2009; only May 2010 (flash crash) and August 2011 (European debt crisis) were worse.
The fall was enough to trigger a sell signal in a popular trend following system.
Trend following dispenses with the debate about recessions, the actions of the Fed, corporate earnings, valuations, China, investor sentiment, market breadth, and all the rest. It focuses purely on price and implicitly assumes that it reflects the most useful information available.
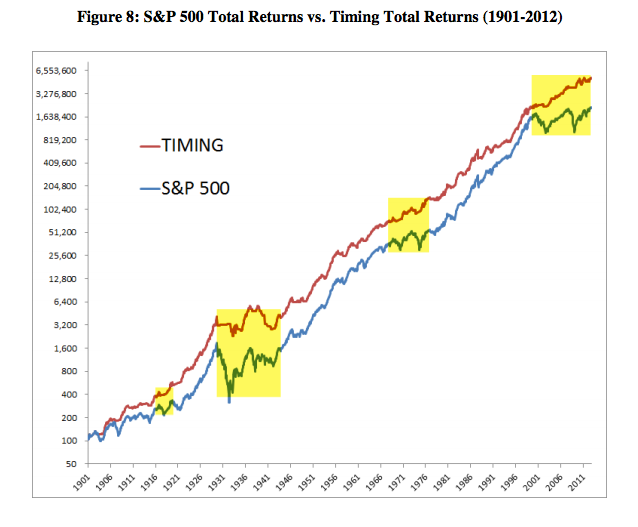
How does it work? As described by Meb Faber here, investors stay long when SPX is above its 10-month moving average (MMA) at month end and move to cash when it closes below. That’s it. The system’s long term track record is excellent (red line), handily beating the SPX (blue line) and 80-90% of professional investors (more on that here). Enlarge any chart by clicking on it.
Today is the last day in October, and SPX closed below the 10-mma for the first time since February 2016. From the buy signal in March 2016 to today, SPX’s total return is almost 40%.
What happens next?
There have been

